A Codyssey Mockumentary Production
This story is fictional. The company, the characters, and Dashboard 73 never existed. But every situation is based on real, documented industry patterns, and every statistic comes from actual 2025 research. If you read this and think "that sounds exactly like my company" — that's the point. It probably is.
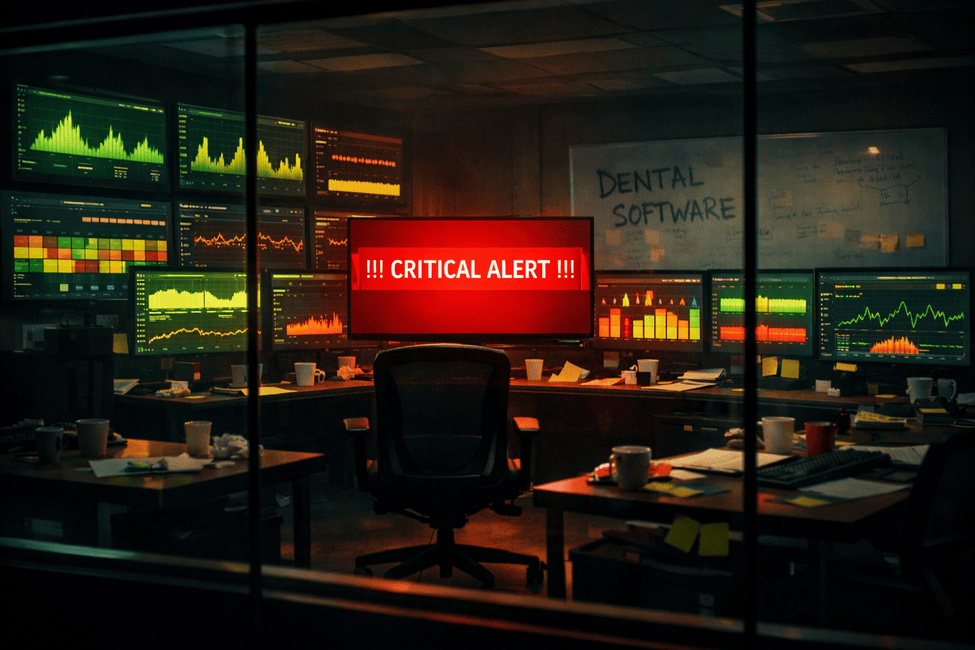
"In the spring of 2023, a mid-sized software company called Meridian Digital Solutions made a decision that would consume their budget, destroy their sleep schedules, and produce the most beautiful collection of dashboards that nobody would ever look at."
"This is their story."
🎬 Chapter 1: The Night Everything Broke
On the night of March 14th, 2023, Meridian Digital Solutions experienced what engineers call a "full production outage" and what the CEO would later describe on a company-wide call as "a growth opportunity."
The payment processing service went down for four hours and seventeen minutes. Customers couldn't check out. Revenue stopped. The support inbox hit three thousand unread messages. One customer posted a screenshot of the error page on Twitter with the caption "lmao they're cooked" and it got forty thousand likes.
Nobody inside the company knew. Not the CTO. Not the engineering team. Not the on-call engineer, because there was no on-call engineer, because there was no on-call rotation, because nobody had set one up, because — and this part still comes up in every retrospective — nobody at Meridian had considered that their software might just stop working one day.
The outage was discovered at 11:43 PM by a customer service representative named Brenda, who emailed the CTO to ask: "Hey, is the website supposed to say 'null' where the prices should be?"
Derek Chambers, CTO:
That night changed everything. A customer service rep found our production outage before any of our technology did. Brenda. She doesn't even work in engineering. She works in a different building. She was checking the site from her phone because she wanted to show her sister what our software looked like.
I told the board: we need observability. World-class. The kind where we know about problems before they happen. Before our customers know. Before physics knows.
Looking back, maybe I oversold it a touch.
🛒 Chapter 2: The Shopping Spree
Within seventy-two hours, Derek had signed contracts with four separate observability vendors. Not because he'd evaluated them. Not because he'd read a single page of documentation or asked his engineering team what they needed. He signed them because each vendor's sales team told him a different horror story about what could happen without their product, and Derek — who hadn't slept properly since the 2:47 AM war room call and was making decisions the way a man buys things at the airport after three delayed flights — said yes to all of them.
Sandra Nguyen, VP of Finance:
He bought Prometheus. Then Grafana Cloud. Then a log management platform. Then a separate tracing solution. Then someone on Reddit — Reddit! — told him about synthetic monitoring, and he bought that too. Five contracts. Seventy-two hours. He used his corporate card for two of them because he couldn't wait for purchase orders.
By June, our observability spend was seventeen percent of our total cloud infrastructure budget. We were spending more money watching our systems than running our systems.
We sell appointment scheduling software. To dentists.
Sandra's horror at the seventeen percent was understandable. What she didn't know yet was that seventeen percent is the industry average. Meridian wasn't an outlier. They weren't even interesting. They were the median.
🧑💻 Chapter 3: The Architect of Everything
Enter Kevin Park. Hired in May 2023 with the freshly invented title of "Principal Observability Architect." A role that existed because Derek read a LinkedIn post about how Netflix has one, and concluded that if Netflix needs one, then surely Meridian — a forty-seven-person company that helps dentists schedule root canals — also needs one.
Kevin's starting salary was higher than three senior developers'. Nobody talked about this openly, but everybody knew because someone in HR left the offer letter in the printer tray.
Kevin Park, Principal Observability Architect:
When I arrived, the only monitoring Meridian had was a bash script that pinged the homepage every five minutes and texted Derek if it got a 500 response. That was the entire system. A cron job and a phone number.
I drew up the architecture on day one. Prometheus for metrics. Jaeger for tracing. Fluentd for logs. Grafana for visualization. OpenTelemetry for instrumentation. AlertManager for routing. PagerDuty for escalation. VictoriaMetrics for long-term storage. Thanos for high-availability. Loki for additional log querying.
When asked how many services Meridian actually runs, Kevin answered: "Twelve."
When asked how many monitoring tools he'd just listed, Kevin counted silently on his fingers, ran out of fingers, and said: "That's not the relevant metric here."
When asked what the relevant metric was, he said: "Coverage." He said the word "coverage" the way other people say "oxygen."
Nobody asked any more questions.
📈 Chapter 4: The Empire of Dashboards
Over the next six months, Kevin built what he privately referred to as "The Cockpit." A growing empire of Grafana dashboards, each one more detailed than the last, covering every metric he could think of and several he appeared to have made up.
By November 2023, Meridian had 147 dashboards. For twelve microservices. That's over twelve dashboards per service, which is a bit like having twelve thermometers per room in your house and still not knowing if you're cold.
Kevin had dashboards for response times, error rates, throughput, JVM heap pressure, garbage collection pauses, thread pool saturation, connection pool utilization, DNS resolution times, and — the one he was most proud of — Dashboard 73, which tracked the P99 latency of the health check endpoint. The endpoint whose entire job is to return the number 200 and the word "healthy." Kevin had built a real-time visualization of how long it took his services to say "I'm fine."
Maria Santos, Senior Backend Developer:
Every Monday, Kevin would announce a new dashboard in Slack. 'Hey team, check out the new JVM Heap Pressure Dashboard!' Everyone would thumbs-up the message. Nobody would click the link. This happened every single week for five months.
I accidentally opened one once and panicked because I thought something was on fire. Turns out that's just what a healthy latency graph looks like when someone chooses red as the default color.
Tommy Wright, Junior Developer:
Kevin showed me something called 'request latency percentiles at P99.9' and when I asked what that meant, he said it 'tells you more about your system's character than any average ever could.'
My system's character. He said that. About software. That schedules dental appointments. Like our checkout endpoint has feelings.
The dashboards kept coming. Nobody asked for them. Nobody stopped them. Kevin was building for a company that didn't exist — a five-hundred-engineer operation with millions of users and globally distributed services. Meridian had twelve services. Most of them did one thing. Several of them worked fine without anyone looking at them at all.
🔔 Chapter 5: When Everything Is Urgent, Nothing Is
Then came the alerts. 2,340 rules. Kevin had configured an alert for every metric, every threshold, every percentile, every service. The average Meridian engineer started receiving 47 notifications per day. Ninety-four percent of them were false positives.
James Chen, Site Reliability Engineer:
The first month, every alert was treated like someone had set the building on fire. 'CPU at eighty-two percent! Everyone stop what you're doing!' Then someone would check and it was fine. CPU goes up during deployments. That's what computers do. That's literally how they work.
By month two, people stopped rushing. By month three, people muted the Slack channel. By month four, someone circulated a Google Doc called 'How To Get Your Life Back' — step-by-step instructions for filtering out every alert. That document got more engagement than anything Kevin ever built. Combined.
James Chen (continued):
My wife asked me why my phone buzzed forty-seven times before lunch. I said it was work. She said it sounded like I was being stalked. I said 'by YAML, technically.'
Derek Chambers, CTO:
I uninstalled PagerDuty from my phone. And this is from my therapist's notes, which I voluntarily shared with the audit committee — the notification sound was triggering a stress response. I was flinching at my toaster because it made a similar ding.
By December, at 2 PM on any given Tuesday, every engineer at Meridian had the alert channel muted. Kevin sat at his desk surrounded by six glowing monitors. He was the only person in the building still watching.
He didn't seem to notice that nobody else was.
💥 Chapter 6: History Repeats Itself
On a freezing February night — almost exactly eleven months after Brenda's email — the payment service went down again. Same service. Same failure mode. Different season.
The monitoring worked perfectly. AlertManager caught it in fourteen seconds. PagerDuty escalated in thirty. Kevin's Cockpit erupted in red like a Christmas tree designed by someone who hates Christmas.
Nobody noticed for four hours.
The alert fired into a muted Slack channel that twenty-three engineers had silenced months ago. James had turned off his phone after nine false-positive wake-ups the night before. Derek didn't have PagerDuty installed anymore. Tommy was playing video games with notifications off because — in his words — "I would rather lose every ranked match in existence than read one more message about garbage collection thresholds."
The outage lasted six hours. Two hours longer than the original.
Derek Chambers, CTO:
I asked James: 'How did we miss this? We have two thousand alerts.' And he looked me dead in the eye and said: 'Derek, that's exactly why we missed it.'
Kevin Park, Principal Observability Architect:
We spent four hundred thousand dollars building the most sensitive alarm system in the state and then trained every person in the company to ignore it.
That's not a technology failure. That's a comedy sketch with a budget.
📋 Chapter 7: The Reckoning
The board sent in Patricia Thornton from Thornton Marsh Consulting. She arrived on a Monday morning with a laptop, a notepad, and what several witnesses described as "the energy of a school inspector who already knows what she's going to find." She asked to see the observability setup and did not stop quietly sighing until Thursday.
Patricia Thornton, Lead Consultant:
Meridian had twelve microservices. Twelve. They had more monitoring tools than things to monitor. The observability infrastructure had its own observability infrastructure. They were monitoring the monitors. I've seen this at companies with three thousand engineers. Meridian has forty-seven.
Patricia's report was sixty-two pages. She bookmarked one page with a sticky note that read "the bad one."
Dashboard 73. It tracked the P99 latency of the health check endpoint. The endpoint that exists to return 200 and the word 'healthy.' Kevin had set an alert on it.
That is not observability. That is an existential crisis expressed in YAML.
She asked Kevin how many of his 2,340 alert rules had produced a true positive in the last ninety days. He said he'd check. He never got back to her.
She checked herself. The answer was one.
Total observability spend for the fiscal year: $487,000. Of Kevin's 147 dashboards, only eleven had been opened by anyone other than Kevin. The log platform was ingesting six terabytes a month, and when Patricia asked three different engineers what they used those logs for, all three said "we don't."
Sandra Nguyen, VP of Finance:
I did the math. We caught one real incident with our monitoring. One. Divide four hundred eighty-seven thousand dollars by one and you get the most expensive alert in the history of dentist software.
I could have hired Brenda to just check the website every five minutes and it would have been cheaper. Brenda makes forty-two thousand a year. We spent half a million on tools that did a worse job than Brenda.
🧹 Chapter 8: The Great Purge
Patricia's recommendation fit in one sentence: measure what matters, alert on what someone will act on, delete everything else.
Kevin did not take it well.
Kevin Park, Principal Observability Architect:
She wanted to go from a hundred and forty-seven dashboards to eight. Eight! Dashboard 73 alone took me two full days. I had the gradient on that latency heatmap dialed in perfectly.
She told me the gradient was irrelevant because nobody had ever seen it.
That was a difficult Tuesday.
Patricia Thornton, Lead Consultant:
He treated observability like a stamp collection. More is always better. Rarer is always more impressive. He wanted to have everything, not to use everything.
But a dashboard exists so someone can make a decision. If nobody is making a decision based on it, it's not a tool. It's a screensaver. A very expensive screensaver that costs more per month than some of his colleagues earn.
They started deleting. Kevin watched dashboards go dark one by one. Somewhere around dashboard 68, he reportedly whispered: "Not 73. Please. Not 73."
73 was deleted.
Kevin was seen leaving the building at 4:15 PM that day. He did not say goodbye to anyone.
🔄 Chapter 9: After
Kevin threatened to resign twice. Derek caught him recreating Dashboard 73 on three separate occasions — once on the staging environment, once on a personal AWS account, and once on what Kevin claimed was "a completely unrelated side project" that happened to have the same gradient, the same heatmap, and the same health check endpoint. Patricia describes it in her final report as "a relapse."
But by August 2024, Meridian had: 8 dashboards instead of 147. 34 alert rules instead of 2,340. Two tools instead of four. Annual spend of $112,000 instead of $487,000. Mean time to detect an incident stayed at 2 minutes — because it turns out 8 dashboards that people actually look at work exactly as well as 147 that nobody opens. Mean time to resolve dropped from 4 hours to 23 minutes — because when your engineer opens one dashboard instead of scrolling through a museum, they find the problem faster.
James Chen, Site Reliability Engineer:
Every alert I get now means something. I reinstalled PagerDuty on my phone. By choice. I never thought I'd say that.
Maria Santos, Senior Backend Developer:
Last month we had a latency spike. Alert fired. I opened the one dashboard that mattered. Eight minutes later I'd found the slow query and rolled back the deployment. Under the old system, we'd have spent three hours not fixing the problem while admiring very pretty graphs of it getting worse.
Meridian survived. James sleeps through the night again. Kevin still brings up Dashboard 73 at least once a month, but he's been writing actual code lately — reviewing pull requests, improving services, doing the kind of work that no number of dashboards can replace.
Sandra got her laptop budget back. She bought the team new chairs. The chairs cost less than Dashboard 73's monthly hosting.
And Brenda from customer service received a formal commendation. She still doesn't understand what the fuss was about. "I just thought the prices were missing. Was I not supposed to email about that?"
A Final Thought 💭
In 2025, alert fatigue was identified as the single biggest obstacle to faster incident response — ahead of staffing, tooling, and budget by a two-to-one margin. Seventy-three percent of organizations reported outages caused by alerts that were suppressed or ignored. Not because the monitoring broke. Because the people stopped believing it. The average company now runs somewhere between six and fifteen observability tools at the same time, and about seventy percent of observability budgets go toward storing logs that nobody ever queries. One company reportedly spends $170 million a year on monitoring alone.
Kevin's mistake wasn't that he was bad at his job. He was good. He was thorough. He knew more about monitoring than anyone in the building. His mistake was that he built for a company that didn't exist. He gave forty-seven developers a system designed for a thousand. He measured things nobody needed measured and answered questions nobody was asking. Observability was never about seeing more. It was about knowing what to ignore. And nobody gets promoted for deleting a dashboard.
Derek's mistake was simpler. He got scared. He spent money to feel safe. Every vendor contract he signed was a prayer dressed up as a purchase order. He didn't need four tools. He needed one meeting — a calm, boring, post-mortem meeting about what broke and what the simplest fix would be. But nobody runs a calm meeting at 3 AM with the board asking why customers are seeing the word "null" where prices should be.
Patricia's advice — measure what matters, alert on what's actionable, delete everything else — fit on a Post-it note. Every company she tells it to nods along. Almost none of them do it. Because deleting things feels like giving up, and building things feels like progress, even when you're building things nobody will ever use.
The question nobody at Meridian thought to ask until they'd spent half a million dollars was the only one that mattered: who is this for?
Every dashboard needs someone who will look at it. Every alert needs someone who will act on it. Every metric needs someone who will make a decision based on what it shows. Not "someone, probably." A specific person, with a name, who knows what they're looking at. If that person doesn't exist, the dashboard is just a fancy loading screen that costs money.
Eight dashboards. That's all Meridian needed. Eight dashboards, thirty-four alerts, and one rule: if nobody will make a decision based on this, get rid of it.
The saddest part of the whole thing isn't the money. It's that for eleven months, Meridian had a system that could catch a failure in fourteen seconds, and nobody was listening. Twenty-three engineers had muted the channel. The CTO had uninstalled the app. The monitoring was screaming into a room where everyone had put in earplugs.
And somewhere, on a server nobody remembers, Dashboard 73 is still rendering a gradient that took two days to get right. It is beautiful. It is precise. It is watching how long a health check endpoint takes to say "I'm fine."
Nobody has ever seen it.
The Codyssey Mockumentary Unit will return. If your organization has a story worth telling, it probably involves a YAML file that nobody fully understands, a meeting that should have been an email, and a dashboard that cost more than a junior developer's salary.
Probably all three. 🎬
📚 Sources
The statistics and industry benchmarks referenced in this article are drawn from publicly available 2024–2025 research, including:
- Alert fatigue as #1 obstacle to incident response — PagerDuty State of Digital Operations, 2025; corroborated by PagerDuty's alert fatigue research
- 73% of organizations experienced outages due to ignored/suppressed alerts — Splunk State of Observability 2025: The Rise of a New Business Catalyst; full report available at splunk.com
- 15–25% average observability spend relative to cloud infrastructure — Honeycomb analysis of observability cost benchmarks; Datadog State of Cloud Costs, 2024; Gartner research on controlling observability spend
- 6–15 observability tools per enterprise — New Relic 2025 Observability Forecast; key findings summarized in New Relic's blog post and APMdigest analysis
- ~70% of observability spend on unqueried logs — Chronosphere / CUBE Research, cited in Chronosphere Logs 2.0 launch; additional reporting by SiliconANGLE and Network World
- Millions in annual monitoring spend at large-scale organizations — Secoda analysis citing $65M quarterly observability bill at a financial services firm; Honeycomb on Gartner customer spending $14M/year; Gartner IT Infrastructure, Operations & Cloud Strategies Conference 2025 on escalating observability costs
- High false positive rates in alerting configurations — aggregated from BigPanda alert noise reduction research and 2025 observability report; PagerDuty research on alert signal-to-noise ratios
- Low dashboard utilization rates and tool sprawl — Grafana Labs Observability Survey 2025 (1,255 respondents; complexity/overhead cited as top obstacle); Grafana Labs Observability Survey 2024 (cost as #1 concern; 2/3 of teams use 4+ technologies); key takeaways blog post
All statistics are used in a fictional narrative context. Specific figures (e.g., $487,000, 147 dashboards) are invented for the story. No endorsement or criticism of any specific vendor is intended. Product names are trademarks of their respective owners.